How to modify metabase.xml to resolve MOSS security error after installing with Kerberos option ?

After installing MOSS 2007 the administration website works, but the sites create after gives security error. The installation is done using Kerberos option. In order to enable Kerberos for SharePoint is configure Service Principle Names (SPNs) for your SharePoint service accounts in Active Directory. Now the following script is ran to make the website work with Kerberos.

C:\Inetpub\AdminScripts>Cscript adsutil.vbs set w3svc/1720207907/root/NTAuthenticationProviders “Negotiate,NTLM”

This script modify the ‘C:\WINDOWS\system32\inetsrv\metabase.xml’ file. When ran the above script it added double quote twice as show below for that website. So both Kerberos and NTML is disabled.

<IIsWebVirtualDir Location =”/LM/W3SVC/418342199/Root” AccessFlags=”AccessExecute | AccessRead | AccessScript”
AppFriendlyName=”Root”
AppIsolated=”2″
AppPoolId=”SharePoint Central Administration v3″
AppRoot=”/LM/W3SVC/418342199/Root”
AuthFlags=”AuthNTLM”
ContentIndexed=”FALSE”
DoDynamicCompression=”TRUE”
DoStaticCompression=”TRUE”
HttpCustomHeaders=”X-Powered-By: ASP.NET
MicrosoftSharePointTeamServices: 12.0.0.4518″
NTAuthenticationProviders=””Negotiate,NTLM””
Path=”C:\Inetpub\wwwroot\wss\VirtualDirectories\43578″
Realm=”domain.com.au”

To fix the above issue run the above command without double quote.

C:\Inetpub\AdminScripts>Cscript adsutil.vbs set w3svc/1720207907/root/NTAuthenticationProviders Negotiate,NTLM

Posted in SharePoint

How to use a network domain account for an ASP.NET applications which gets the logged on user name from the computer?

1.  In IIS 6 set the following in the application pool for the website.


How to use a network domain account for an ASP.NET applications which gets the logged on user name from the computer using?

How to use a network domain account for an ASP.NET applications which gets the logged on user name from the computer using?


2. Create the website and assign the above application pool.

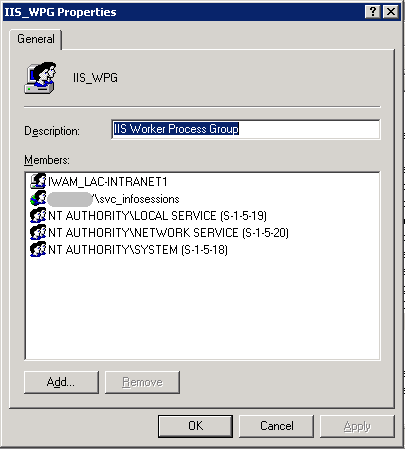
3. Add the domain service account to the IIS WPG group on the hosting server.


Go to Computer Management > Local Users and Groups >Groups>IIS WPG. Right click on IIS WPG and go to properties. Add domain service account.

Go to Computer Management > Local Users and Groups >Groups>IIS WPG. Right click on IIS WPG and go to properties. Add domain service account.


4. In the web.config of the application add the following connection string

<add name=Connection Name connectionString=Data Source=ServerName;Initial Catalog=DatabaseName;Integrated Security=TrueproviderName=System.Data.SqlClient />

5. In the web.config also add identity tag

<system.web> <identity impersonate=true userName=DomainName\DomainAccountName password=DomainAccontPassword/> <system.web>

6. Now in you code if you use the code below it will show the logged on user name

ASP.NET

<div class=”group”>
    <asp:Label ID=”lblSearchUserName” runat=”server”>User Name : </asp:Label> <asp:TextBox ID=”txtSearchUserName” CssClass=”Search” MaxLength=”10″                ValidationGroup=”vgSearchForm” runat=”server” /> (Eg.<%=Replace(Trim(Request.ServerVariables.Item(“LOGON_USER”).ToLower), “domainName\”, “”)%>) <br />
</div>


VB.NET

If (Not String.IsNullOrEmpty(Request.ServerVariables.Item(“LOGON_USER”))) Then Dim LogonUserName As String = Trim(Request.ServerVariables.Item(“LOGON_USER”).ToLower)

 ~~

 ~~

 Else             
             Response.Redirect(“Resources/Error/LogOnNameError.htm”)
End If ‘LOGON_USER

Reference:

http://msdn.microsoft.com/en-us/library/72wdk8cc.aspx


Posted in ASP.NET

How to use the developer tools with Windows Internet Explorer 8 Release Candidate 1 release notes

If the developer tools are enabled before resetting Internet Explorer to default settings, the developer tools will not be hidden as expected. To correct this, you can hide the toolbar manually by pressing F12. Pressing F12 again toggles the toolbar back on.

When you use the developer tools, please be aware of the following additional items:

Inspecting HTML elements

  • Contents of an IFRAME cannot be inspected using the HTML tree view if the first child node of the IFRAME is a comment.
  • When using the select element by click command, the selected element is not highlighted if that element already has focus in the HTML tree view of the toolbar.
  • Executing a Jscript command in the address bar will disable the HTML tree in the developer tools. To work around this, refresh the page.
  • Refreshing an RSS feed while using the developer tools will cause the HTML tree to be hidden. To work around this, close and re-open the developer tools.
  • Child HTML elements of OBJECT tags do not appear in the HTML tree view. To work around this, right-click on the page and choose View Source. Then navigate to the line containing the OBJECT tag of interest. Alternatively, load the HTML of the OBJECT tag in a separate browser window and then use the developer tools HTML tree view to examine the source.
  • In the attributes tab of the developer tools, toggling “show read-only properties” disables the ability to add new attributes. To work around this, refresh the page.
  • When working with XML documents, the HTML tree displays the source Internet Explorer uses to render the XML, not the original XML markup. To view the original source, right-click on the page and select View Source.

Debugging CSS styles

  • In the Trace styles tab, displayed styles are calculated using the Internet Explorer 8 standards mode. Switching the Browser or Document Mode will not change the logic used to calculate traced styles.
  • If a page references the same CSS file from two or more style blocks, the CSS tab will display duplicate entries for the file.

Using the Script debugger

  • Although the Script debugger can be used for debugging any engine implementing IActiveScript interfaces (like VBScript), only JScript debugging is supported.
  • We do not recommend that you use the JScript debugger when multiple tabs are open. The behavior in multiple tab scenarios is undefined and could cause the browser to stop responding. To work around this issue, use only one tab per Internet Explorer instance when debugging.
  • When in a breakpoint, changing the Internet Explorer document mode or browser mode will cause the browser to stop responding. To avoid this, change the document mode or browser mode before reaching a breakpoint, or press F5 to continue and then change the document mode or browser mode.
  • When in a breakpoint, Internet Explorer is paused and is waiting for input from the script debugger. Therefore, it does not respond to any user interaction. The Internet Explorer window is not updated, and other developer tools features, such as the HTML and CSS tabs, do not function. This condition occurs because the tools depend on receiving data from Internet Explorer.
  • After you click Start debugging, JScript errors continue to display error dialog boxes. This behavior occurs even if you click Stop debugging. To stop the dialog boxes from appearing, check the box next to Do not show this message again and click No in the Internet Control Panel.
  • Expandos that are added to DOM objects are not shown when you view these objects in Locals and Watch windows.
  • JScript errors may appear in English on non-English operating system installations.
  • If you start script debugging while the developer tools are pinned, the toolbar may hang on Windows XP. To avoid this, unpin the developer tools prior to launching script debugging.

Using the Script profiler

  • Although the Script profiler can be used for profiling any engine implementing IActiveScript interfaces (like VBScript), only JScript profiling is supported.
  • We do not recommend that you use the profiler when multiple tabs are open. The performance data in multiple scenarios could be misleading and incorrect.
  • Source information (URL and line number) is not available if script debugging is disabled in Internet Explorer. To work around this, uncheck the Disable script debugging (Internet Explorer) entry in the Internet Options.
  • When you export a profiler report, the Functions view is shown. All available columns are exported in a default order. This is also the case even if the current view of the report is set to some other view.

Using the default page source viewer

  • When saving a page from the default source viewer that is encoded in Japanese UTF-8/JIS, garbage is appended to the file following the element. To work around this, edit the saved file and remove all content after the tag.
  • When using the default source viewer, screen readers do not properly render source code as a webpage. To work around this, press F7 while focus is in the view source window to turn off caret browsing. Then press ALT+TAB to lose window focus, and then press ALT+TAB again to return focus to the source viewer window.


http://support.microsoft.com/kb/949787

Posted in Software